
SIP2
Monitoring livestock drinking behaviour to
protect herd health and reduce farm visits
Sector
Livestock / beef production
Country
France
SIP Leader
IDELE
Participants
Pilot site: CIRBEEF farm
The challenge
From Periodic Checks to Continuous Monitoring
Livestock farmers visit their pastures every one to two days to check on their animals — a time-consuming routine that does not guarantee early detection of health problems. An animal that stops drinking may already be unwell by the time the next visit happens.
SIP2 set out to replace periodic manual checking with continuous automated monitoring of water trough activity, using RFID technology already familiar in the livestock sector. The goal: give farmers a daily picture of their herd from wherever they are.
How the System Works
RFID-Based Trough Monitoring, Automatically
A UHF RFID case is installed at the water trough in the pasture. Each animal in the herd wears a UHF ear tag. Every time an animal approaches the trough, the reader detects the tag and records the visit, noting which animal, when it arrived, and when it left.
This data builds a daily record of drinking activity across the entire herd. If an animal misses a visit or its pattern changes significantly, the system flags it. Early detection of changed drinking behaviour is a reliable indicator of health issues before visible symptoms appear.
The system was tested in two modes: a Cloud mode that transmits data in near real time via 4G/5G, allowing remote monitoring through a back-office dashboard; and an Edge mode that stores data locally and syncs via Bluetooth when the farmer visits, with an intuitive colour-coded mobile app.
UHF ear tags on each animal are detected automatically as they approach the trough.
Visit data — which animal, arrival time, departure time — is recorded continuously.
Cloud mode transmits data in near real time. Edge mode stores locally and syncs on next visit.
Farmers see a daily herd report. Animals with no trough visit are flagged automatically.
Two deployment modes tested
Cloud and Edge -Tested in Parallel
CLOUD MODE
Transmits trough visit data in near real time via 4G/5G. Farmers can check their herd remotely from any device without visiting the pasture.
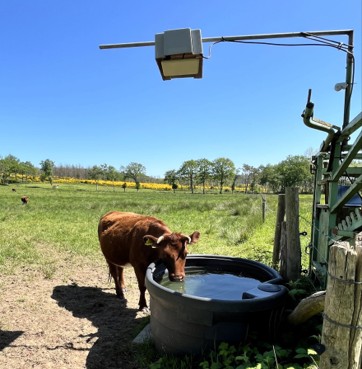
Device installed in the pasture — UHF antenna positioned directly above the drinking trough, out of reach of the animals.
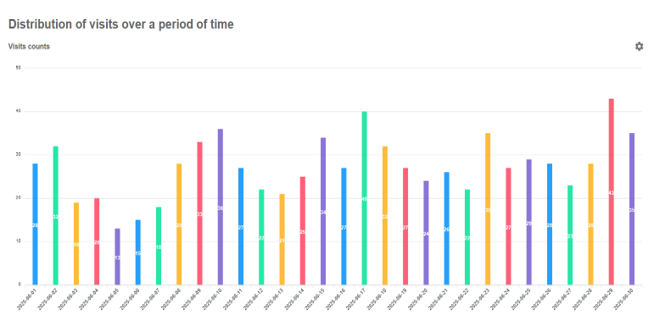
Number of visits to the drinking trough over a month for a group of 10 cattle (e.g. France / Brittany, June 2025)
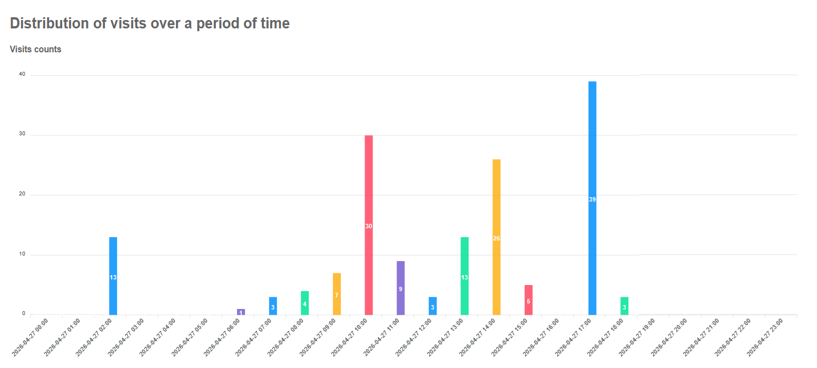
Number of visits per day for a herd of 42 cattle (Limousin, France, 27 April 2026)
EDGE MODE
Stores data locally on a mini-PC. The farmer syncs via Bluetooth on each visit and reviews a colour-coded report on their smartphone. No internet required.
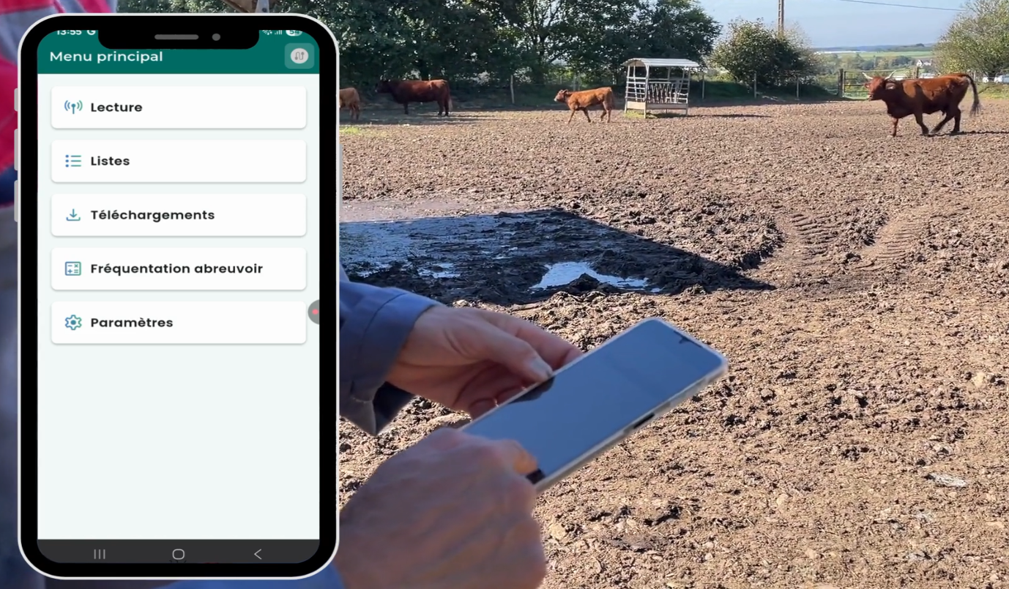
Edge-Based Model: Performs localized processing on-site, reducing the need for continuous cloud connectivity.
Edge-Based Model: Performs localized processing on-site, reducing the need for continuous cloud connectivity.
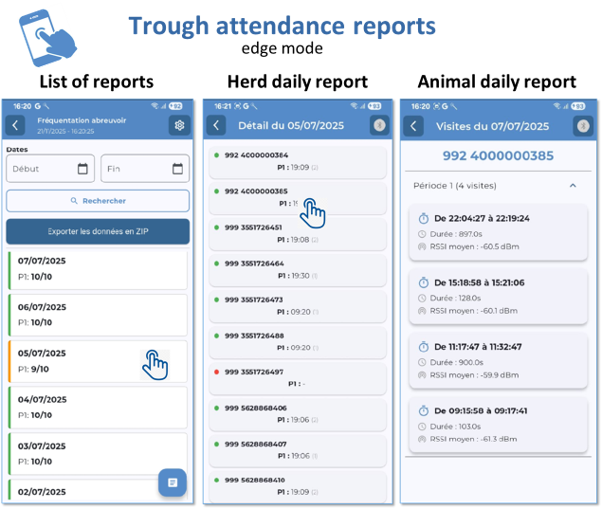
Generating daily attendance reports
What farmers said
After Year 1, participating farmers and advisors shared their experience using the water trough monitoring system in both Cloud and Edge modes.
Ease of use and adoption
The Edge mode is rated as very easy to use and is a major driver of adoption. The Cloud mode is considered moderately easy to use but faces greater uncertainty around wider recommendation. Both modes encounter some resistance due to the novelty of digital livestock monitoring.
Data privacy
Many grazing areas lack reliable mobile coverage, making Cloud real-time monitoring impractical in the field. The Edge mode is better suited to these environments, processing data locally and transmitting only lightweight outputs when connectivity is available.
Recommended approach
Users strongly prefer the Edge mode on both technical and practical grounds. Local processing reduces bandwidth and energy use, keeps data on-site, and ensures reliable operation in low-connectivity rural environments.
“Where there is no signal, Edge just works.”
Year 1 headline results
herd accuracy
Perfect match between system records and visual observations of animal arrivals and departures throughout the pilot.
fewer field visits
Cloud mode enables farmers to visit once every 3 days instead of every 2, saving time, fuel and labour over the full grazing season.
diesel saved per season
Cloud mode saves 44 litres of diesel per grazing season by enabling remote herd monitoring instead of daily field visits.
Year 1 results: full breakdown
Results are organised across 4 dimensions. Each compares the Cloud and Edge deployment mode side by side. Dimension 4 is represented above in the section What farmers said.
| Metric | Cloud | Edge | What this means |
|---|---|---|---|
| Visit detection algorithm | P1 (gap between visits) = 600s. P2 (minimum visit duration) = 5s. Same for both modes. | The algorithm correctly identifies every genuine drinking visit. Animals visiting for under 5 seconds are not counted — a deliberate filter for non-drinking interactions. | |
| Overall herd monitoring accuracy | Perfect match on all visual observations across multiple field sessions. | 100% match between system records and observed animal presence throughout the pilot. No discrepancies recorded. | |
| Detection of changed drinking behaviour | Real-time data available. Farmer must actively check the back-office. Individual alert system to be improved in Year 2. | Colour-coded report: orange for herd alert, red for individual animal. Intuitive but data delayed by 48 hours. | Cloud is faster; Edge is more user-friendly. Individual alerting to be improved across both modes. |
| Cost efficiency | Pilot (94 days, 31 visits): 180 EUR. Full season (80 visits): 450 EUR. | Pilot (94 days, 47 visits): 267 EUR. Full season (120 visits): 680 EUR. | Cloud enables 33% fewer visits and lower cost per season. |
| Time saved | Pilot: 16 hours saved. Full grazing season: 40 hours saved. | No time saving. Edge requires a physical visit to sync data. | Cloud enables meaningful labour savings. Edge offers no reduction in visit frequency. |
| Metric | Cloud | Edge | What this means |
|---|---|---|---|
| Network utilisation | Download 327 MB + Upload 1,535 MB over 94 days via 4G/5G. | Zero. No network connection required. | Cloud delivers near real-time monitoring. Edge operates with complete network independence. |
| Computing resources | Requires remote database and back-office server. CPU/memory metrics not available during pilot — to be collected in Year 2. | Mini-PC and Android smartphone. No servers or subscriptions required. Scales with herd size. | Edge runs fully standalone. Cloud computing metrics will be available in Year 2. |
| Energy per day | 276 Wh per day (UHF case + 24/7 4G router). | 156 Wh per day (UHF case only — no router). | Edge uses 43% less energy per day. The entire difference is the router. |
| Total farming operation energy | Full season: 1,445 km / 87 L diesel (1 visit per 3 days). | Full season: 2,180 km / 131 L diesel (1 visit per 2 days). | Cloud saves 44 L of diesel per season by enabling remote monitoring. |
Note: Cloud computing resource metrics (CPU, memory) were not available during the pilot. Data collection in progress for Year 2.
| Metric | Cloud | Edge | What this means |
|---|---|---|---|
| Data formats | CSV. Key fields modelled using OCSM semantics. Integrated with OpenAgri Farm Calendar. | CSV only. Minimal semantic annotation. | Cloud uses richer interoperable standards. Edge keeps it simple and local. |
| Connectivity | 4G/5G cellular. | Bluetooth local pairing only. | No protocol constraints in either mode. Choice depends on farm infrastructure. |
| Software switchability | Same for both modes. Full data download in open CSV format. | No alternative software currently available. Raw and pre-processed CSV data downloadable in both modes. | |
| Farm data switchability | Full data portability in both modes. | Raw RFID data and processed visit data fully available in CSV. Filterable by date. No vendor lock-in. | |
| Hardware switchability | Same core hardware for both modes. High flexibility on component selection. | UHF case compatible with Honeywell and Impinj readers. Any 4G router with RJ45. Any compatible solar station. Only the router differs between modes. | |
OPENAGRI OS-BASED SERVICES USED
PILOT DETAILS
- SIP Leader: IDELE (Institut de l’Elevage)
- ADS partner: CIRBEEF (farm and end users)
- Sector: Livestock / Beef production
- Country: France
- Pilot duration: 94 days